Latest stats show trends for the 2nd and 3rd quarters of 2016
Two years since the Government’s pension flexibility reforms came into effect, the majority of savers with larger pots are using them to buy a retirement product – either a guaranteed income (annuity) or flexible income (drawdown). The sum being withdrawn when a pension pot is taken as one lump sum the first time it is accessed has fallen to an average of £14,000.
The level of activity remains high with around 170,000 pension pots being accessed for the first time during the second and third quarters of 2016 and 82,100 new products being sold.
This compares with 87,500 new products being sold in the same quarters of the previous year. Other direct comparisons are not possible because of a change to the FCA data collection, which the ABI’s own collection is aligned with.
During the second and third quarters of 2016, figures show that for pay-outs:
- The number of pots being taken as one lump sum the first time they are accessed remained high, but the average amount taken was down to £14,000 compared with more than £15,000 in the first year after the reforms.
- The average sum being taken by people going into drawdown for the first time was just over £2,000. Previous figures, covering all customers in drawdown during the first twelve months of the flexibilities, showed average payments over £3,500.*
During the second and third quarter of 2016, for funds invested in new products:
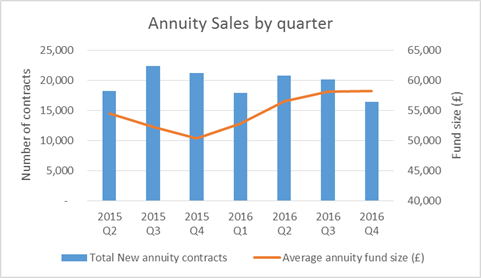
- Annuities continued to hold their own against drawdown products in terms of the number of new products taken out. The value of the average fund invested climbed to £56,500 and then £58,100.
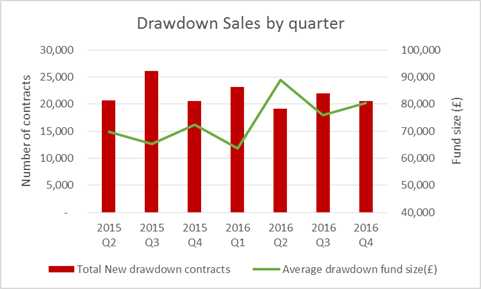
- The average fund size being invested in new drawdown products has also continued to climb, peaking at £88,900 in Q2 2016.
- The proportion of customers switching provider to buy either an annuity or drawdown product was at 50% for Q3 2016.
A more detailed breakdown of these statistics is provided in the ABI retirement income factsheet below.
The ABI’s Head of Retirement Policy, Rob Yuille, said:
“It was inevitable that fewer people would choose a guaranteed income for life if they had the option of a lump sum, but after an initial dash for cash the market is settling. While the numbers of those taking their pensions as a lump sum remains high, the average pot taken is relatively small with the majority of funds going into either a guaranteed income for life or a flexible income product.
“Flexibility is more meaningful to those who have been able to save more. Auto-enrolment has worked well to get millions more people saving for a pension. The priority now has to be increasing savings levels, and ensuring self-employed and part-time workers don’t get left behind.”
ABI retirement income factsheet
|
|
First year of reforms |
Q2 2016 |
Q3 2016 |
|
Pension pots fully withdrawn on first access |
£3.3bn paid through 216,300 full withdrawals. An average withdrawal of just over £15,200. |
£860m paid through 60,800 full withdrawals. An average withdrawal of just over £14,100 |
£767m paid through 55,000 full withdrawals. An average withdrawal of just over £13,900 |
|
Flexible income (drawdown) withdrawals |
£3.9bn paid out via 1.03m income drawdown payments, an average payment of £3,800. |
|
|
|
Flexible income (drawdown) withdrawals (new entrants)* |
|
£59m paid to 27,500 new entrants to drawdown, with an average payment of almost £2,200 |
£52m paid to 26,500 new entrants to drawdown, with an average payment of almost £2,000 |
|
Guaranteed income (annuity) sales |
£4.2bn invested in around 80,000 annuities, making the average fund invested nearly £52,500. |
£1.18bn invested in 20,800 annuities, making the average fund size £56,500. |
£1.17bn invested in 20,100 annuities making the average fund size just over £58,100 |
|
Flexible income product (drawdown) sales |
£6.1bn invested in 90,700 income drawdown products, an average fund of just over £67,500. |
£1.7bn invested in 19,100 income drawdown products, an average fund size of just over £88,900. |
£1.67bn invested in 22,000 income drawdown products, an average fund size of just over £76,000. |
*Information about drawdown payments is only collected for new entrants to drawdown from Q2 2016 because of a change to the FCA data collection, which the ABI’s own collection is aligned with.